Develop a Trading Methodology Based on Facts
Taking the time to develop a sound trading methodology is worth the effort. It may be tempting to believe in the "so easy it's like printing money" trading scams that are prevalent on the internet. But facts, not emotions or hope, should be the inspiration behind developing a trading plan.
Traders who are not in a hurry to learn typically have an easier time sifting through all of the information available on the internet. Consider this: if you were to start a new career, more than likely you would need to study at a college or university for at least a year or two before you were qualified to even apply for a position in the new field. Expect that learning how to trade demands at least the same amount of time and factually driven research and study.
Know When to Stop Trading
There are two reasons to stop trading: an ineffective trading plan, and an ineffective trader.
An ineffective trading plan shows much greater losses than anticipated in historical testing. Markets may have changed, volatility within a certain trading instrument may have lessened, or the trading plan simply is not performing as well as expected. One will benefit from remaining unemotional and businesslike. It might be time to reevaluate the trading plan and make a few changes or to start over with a new trading plan. An unsuccessful trading plan is a problem that needs to be solved. It is not necessarily the end of the trading business.
An ineffective trader is one who is unable to follow his or her trading plan. External stressors, poor habits and lack of physical activity can all contribute to this problem. A trader who is not in peak condition for trading should consider a break to deal with any personal problems, be it health or stress or anything else that prohibits the trader from being effective. After any difficulties and challenges have been dealt with, the trader can resume.
Keep Trading in Perspective
It is important to stay focused on the big picture when trading. A losing trade should not surprise us - it is a part of trading. Likewise, a winning trade is just one step along the path to profitable trading. It is the cumulative profits that make a difference. Once a trader accepts wins and losses as part of the business, emotions will have less of an effect on trading performance. That is not to say that we cannot be excited about a particularly fruitful trade, but we must keep in mind that a losing trade is not far off.
Setting realistic goals is an essential part of keeping trading in perspective. If a trader has a small trading account, he or she should not expect to pull in huge returns. A 10% return on a $10,000 account is quite different than a 10% return on a $1,000,000 trading account. Work with what you have, and remain sensible.
Despite the fluid nature of each trading day, price patterns can recur, signaling trading opportunities for investors who know what to look for. Those changes in daily prices that seem random could actually be indicators of trends that day traders can take advantage of.
The following five day-trading setups, or entry strategies, have a tendency to emerge in the market at some point on many, but not all, days. By learning to recognize these trading setups, a day trader may take actions that could improve their chances of seeing a profitable return.
11 most important chart patterns
The following chart patterns are the most recognizable and common trading patterns to look out for when using technical analysis to trade shares, forex and other markets. Following our guide of the 11 most important stock chart patterns that can be applied to most financial markets could be a good way to start your technical analysis.
1. Ascending triangle
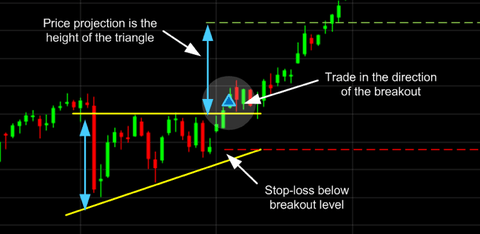
The ascending triangle is a bullish ‘continuation’ pattern that signifies a breakout is likely where the triangle lines converge. To draw this pattern, you need to place a horizontal line (the resistance line) on the resistance points and draw an ascending line (the uptrend line) along the support points.
2. Descending triangle
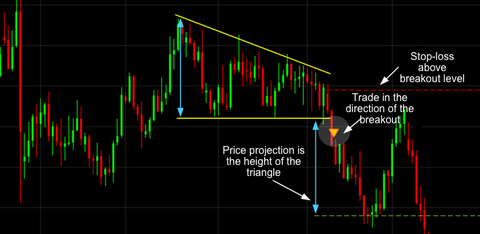
Unlike ascending triangles, the descending triangle represents a bearish market downtrend. The support line is horizontal, and the resistance line is descending, signifying the possibility of a downward breakout.
3. Symmetrical triangle
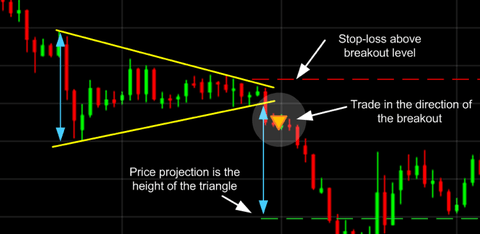
For symmetrical triangles, two trend lines start to meet which signifies a breakout in either direction. The support line is drawn with an upward trend, and the resistance line is drawn with a downward trend. Even though the breakout can happen in either direction, it often follows the general trend of the market.
4. Pennant
Pennants are represented by two lines that meet at a set point. They are often formed after strong upward or downward moves where traders pause and the price consolidates, before the trend continues in the same direction.
5. Flag
The flag chart pattern is shaped as a sloping rectangle, where the support and resistance lines run parallel until there is a breakout. The breakout is usually the opposite direction of the trendlines, meaning this is a reversal pattern.
6. Wedge
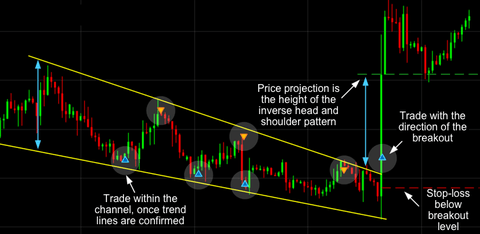
A wedge represents a tightening price movement between the support and resistance lines, this can be either a rising wedge or a falling wedge. Unlike the triangle, the wedge doesn’t have a horizontal trend line and is characterized by either two upward trend lines or two downward trend lines.
For a downward wedge it is thought that the price will break through the resistance and for an upward wedge, the price is hypothesized to break through the support. This means the wedge is a reversal pattern as the breakout is opposite to the general trend.
7. Double bottom
A double bottom looks similar to the letter W and indicates when the price has made two unsuccessful attempts at breaking through the support level. It is a reversal pattern as it highlights a trend reversal. After unsuccessfully breaking through the support twice, the market price shifts towards an uptrend.

8. Double top
Opposite to a double bottom, a double top looks much like the letter M. The trend enters a reversal phase after failing to break through the resistance level twice. The trend then follows back to the support threshold and starts a downward trend breaking through the support line.

9. Head and shoulders
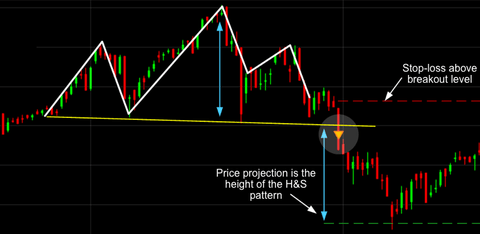
The head and shoulders pattern tries to predict a bull to bear market reversal. Characterized by a large peak with two smaller peaks either side, all three levels fall back to the same support level. The trend is then likely to breakout in a downward motion.
10. Rounding bottom
A rounding bottom or cup usually indicates a bullish upward trend. Traders can buy at the middle of the U shape, capitalizing on the bullish trend that follows as it breaks through the resistance levels.
11. Cup and handle
The cup and handle is a well-known continuation pattern that signals a bullish market trend. It is the same as the above rounding bottom, but features a handle after the rounding bottom. The handle resembles a flag or pennant, and once completed can see the market breakout in a bullish upwards trend.


